Curious Charts
- rtwort
- Nov 15, 2025
- 1 min read
I've seen numerous barograph charts over the years although most are either the old English style in inches, generally 28" - 31" or the more recent and now generally accepted 950 millibars to 1050 millibars.In France you can occasionally still see the equivalent range in millimeters 710 to 810.
However, here's three which are quite unusual and not often seen.
Can anyone add other strange ones?
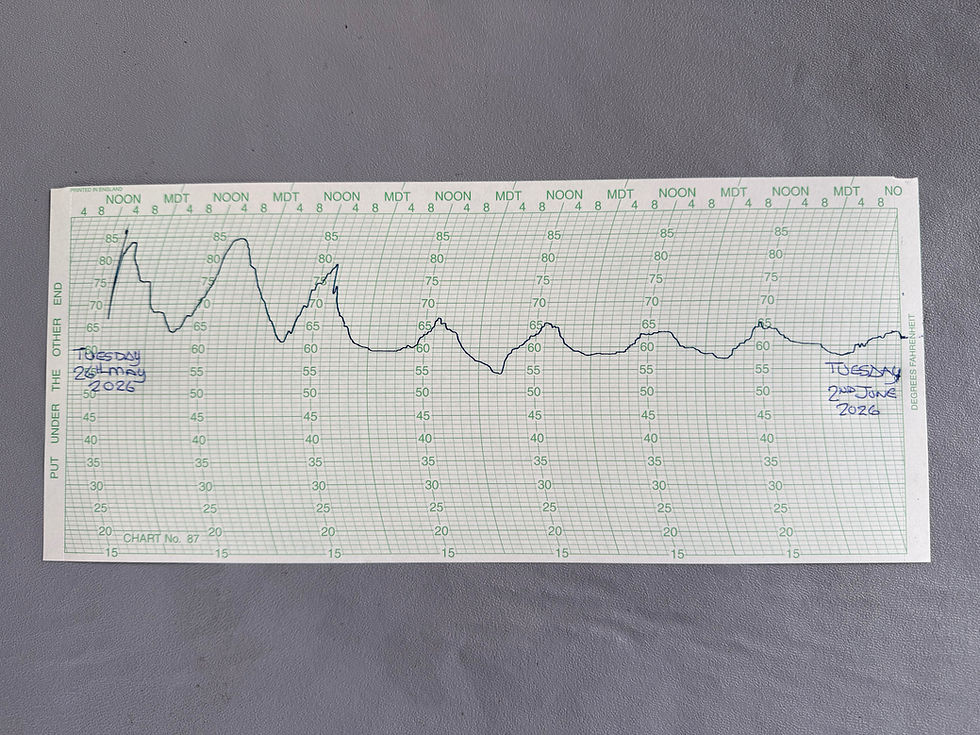
From the top down:
A rare two weekly chart printed in inches.
A highly graphic chart in millibars depicting weather phenomenum. Taken from an educational wallchart designed and produced by Negretti and Zambra some 70 years ago and even used on their Christmas card in the late 1950s! Copied in the 1980s by Russell of Norwich. Difficult to read a chart recording unless a very thick pen was used!
This weekly chart features the weather forecast for the various rising and falling pressure readings, in green and red. I would imagine this chart would have been recommended for someone using a barograph for the first time and possibly for schools . Originally made by Short and Mason and later, as this one, by Casella.


Comments